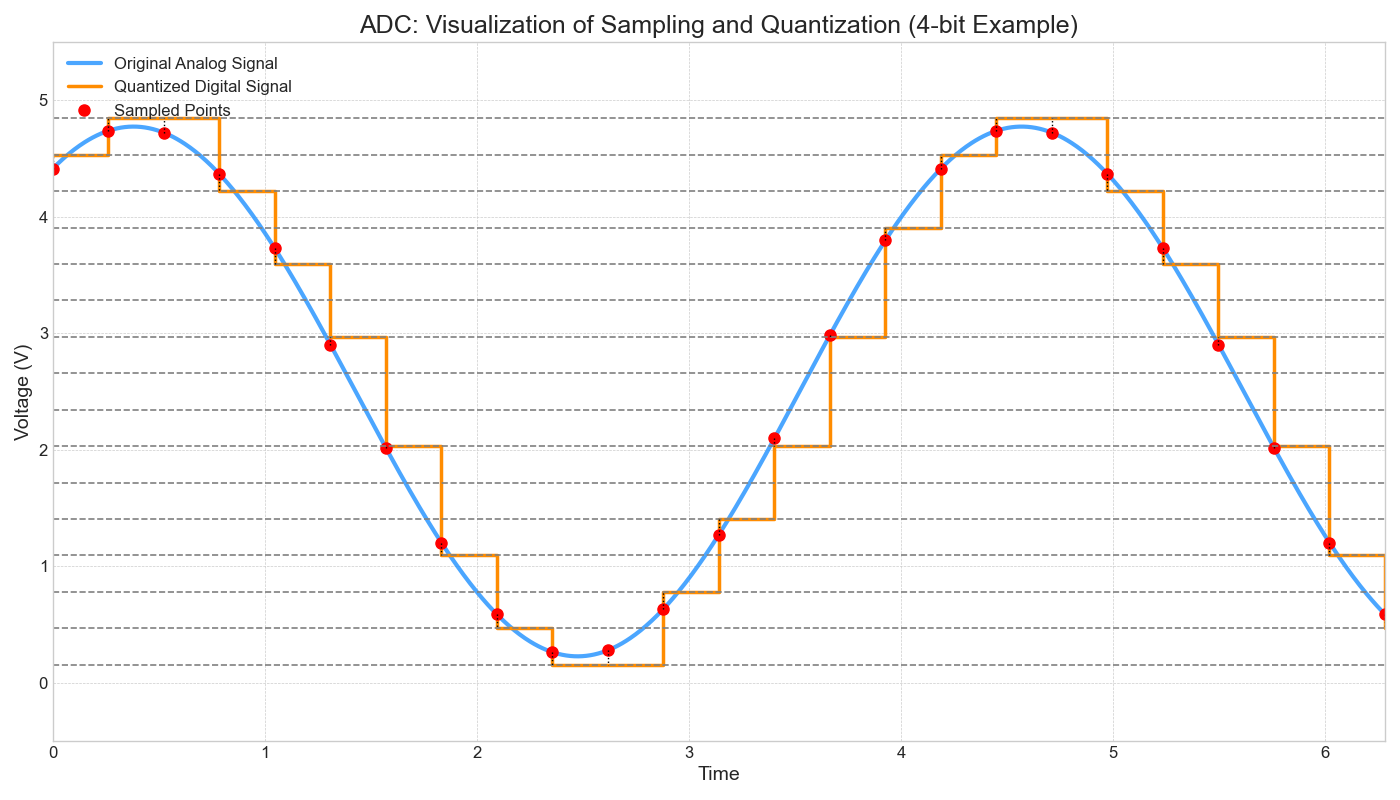
Visualizing Sampling and Quantization
Imagine measuring a smooth curve (analog signal) but only being able to use a staircase (digital steps) to represent it.
- The red dots represent the sampling points.
- The blue steps represent the quantized digital values assigned at each sample.
- The ADC approximates the smooth analog curve with these discrete steps.
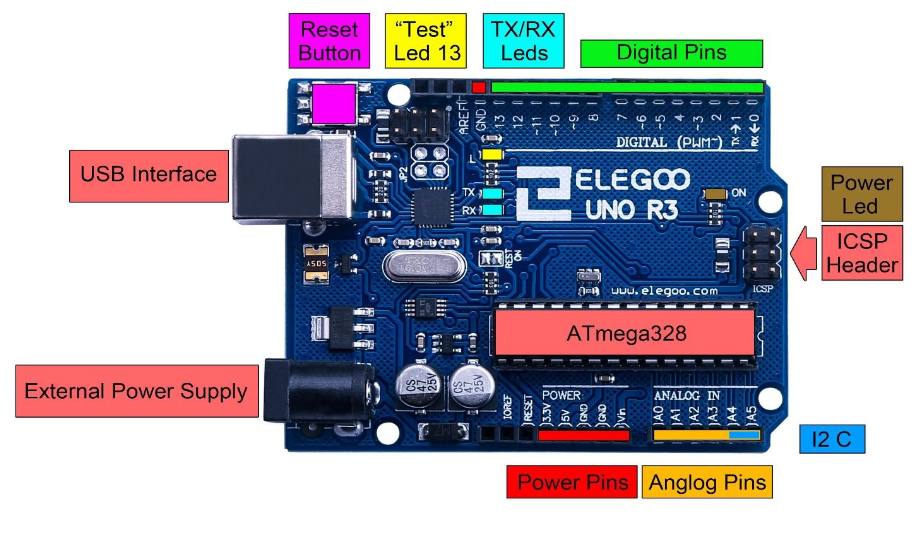
Analog Pins on Arduino
The Arduino Uno has dedicated pins for analog input. These are connected to the microcontroller's internal ADC.
- They are labeled A0 through A5 on the board.
- These 6 pins form a multiplexer, which means they all feed into the single ADC on the chip, one at a time.
- While they are primarily for analog input, they can also be used as digital I/O pins if needed.
Potentiometer Circuit Diagram
A potentiometer has three pins:
- Outer Pin 1: Connect to Ground (GND) on the Arduino.
- Center Pin (Wiper): Connect to an analog input pin (e.g., A0) on the Arduino. This is the pin that outputs the variable voltage.
- Outer Pin 2: Connect to 5V on the Arduino.
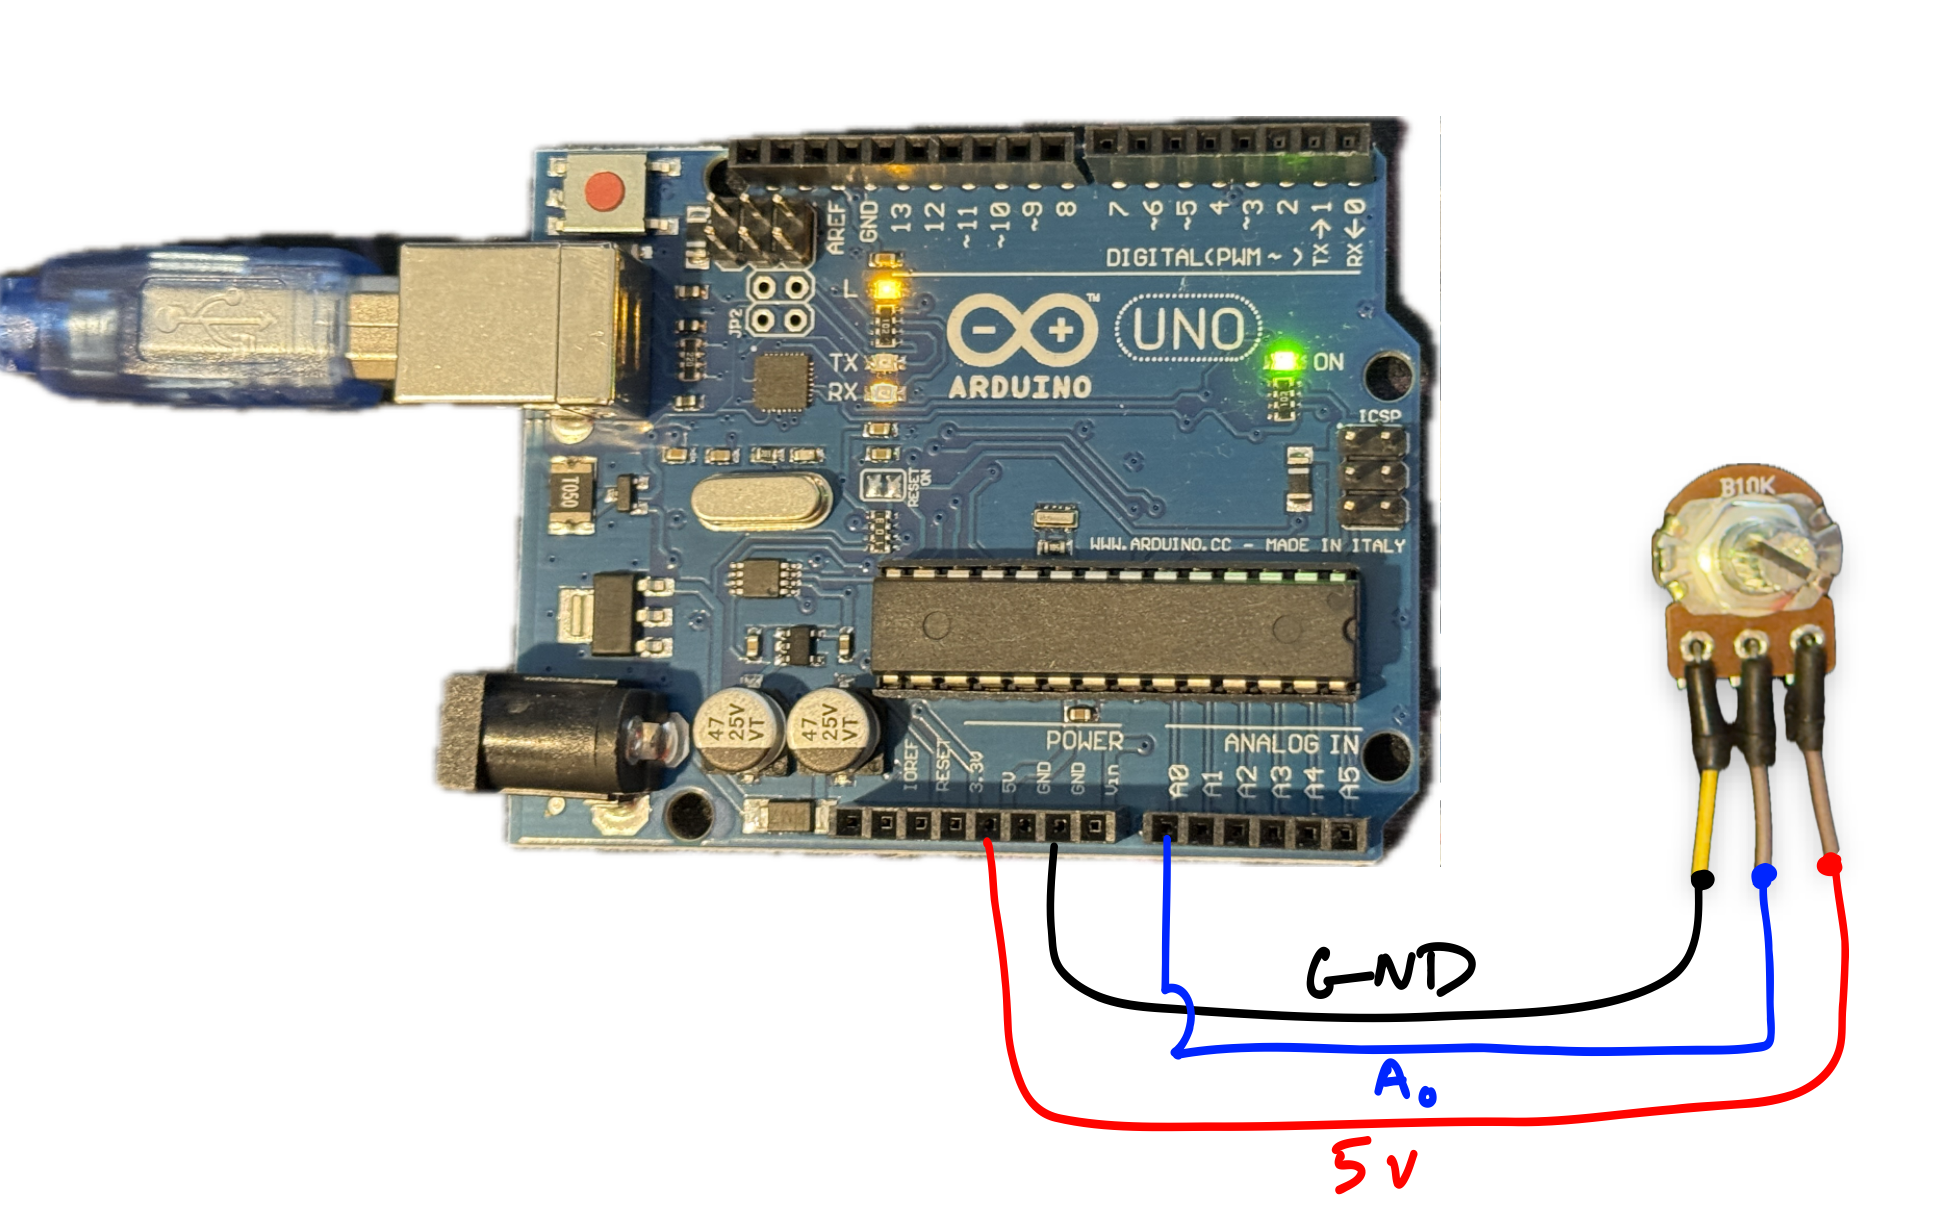
Turning the knob moves the wiper, changing the voltage on pin A0 from 0V to 5V.
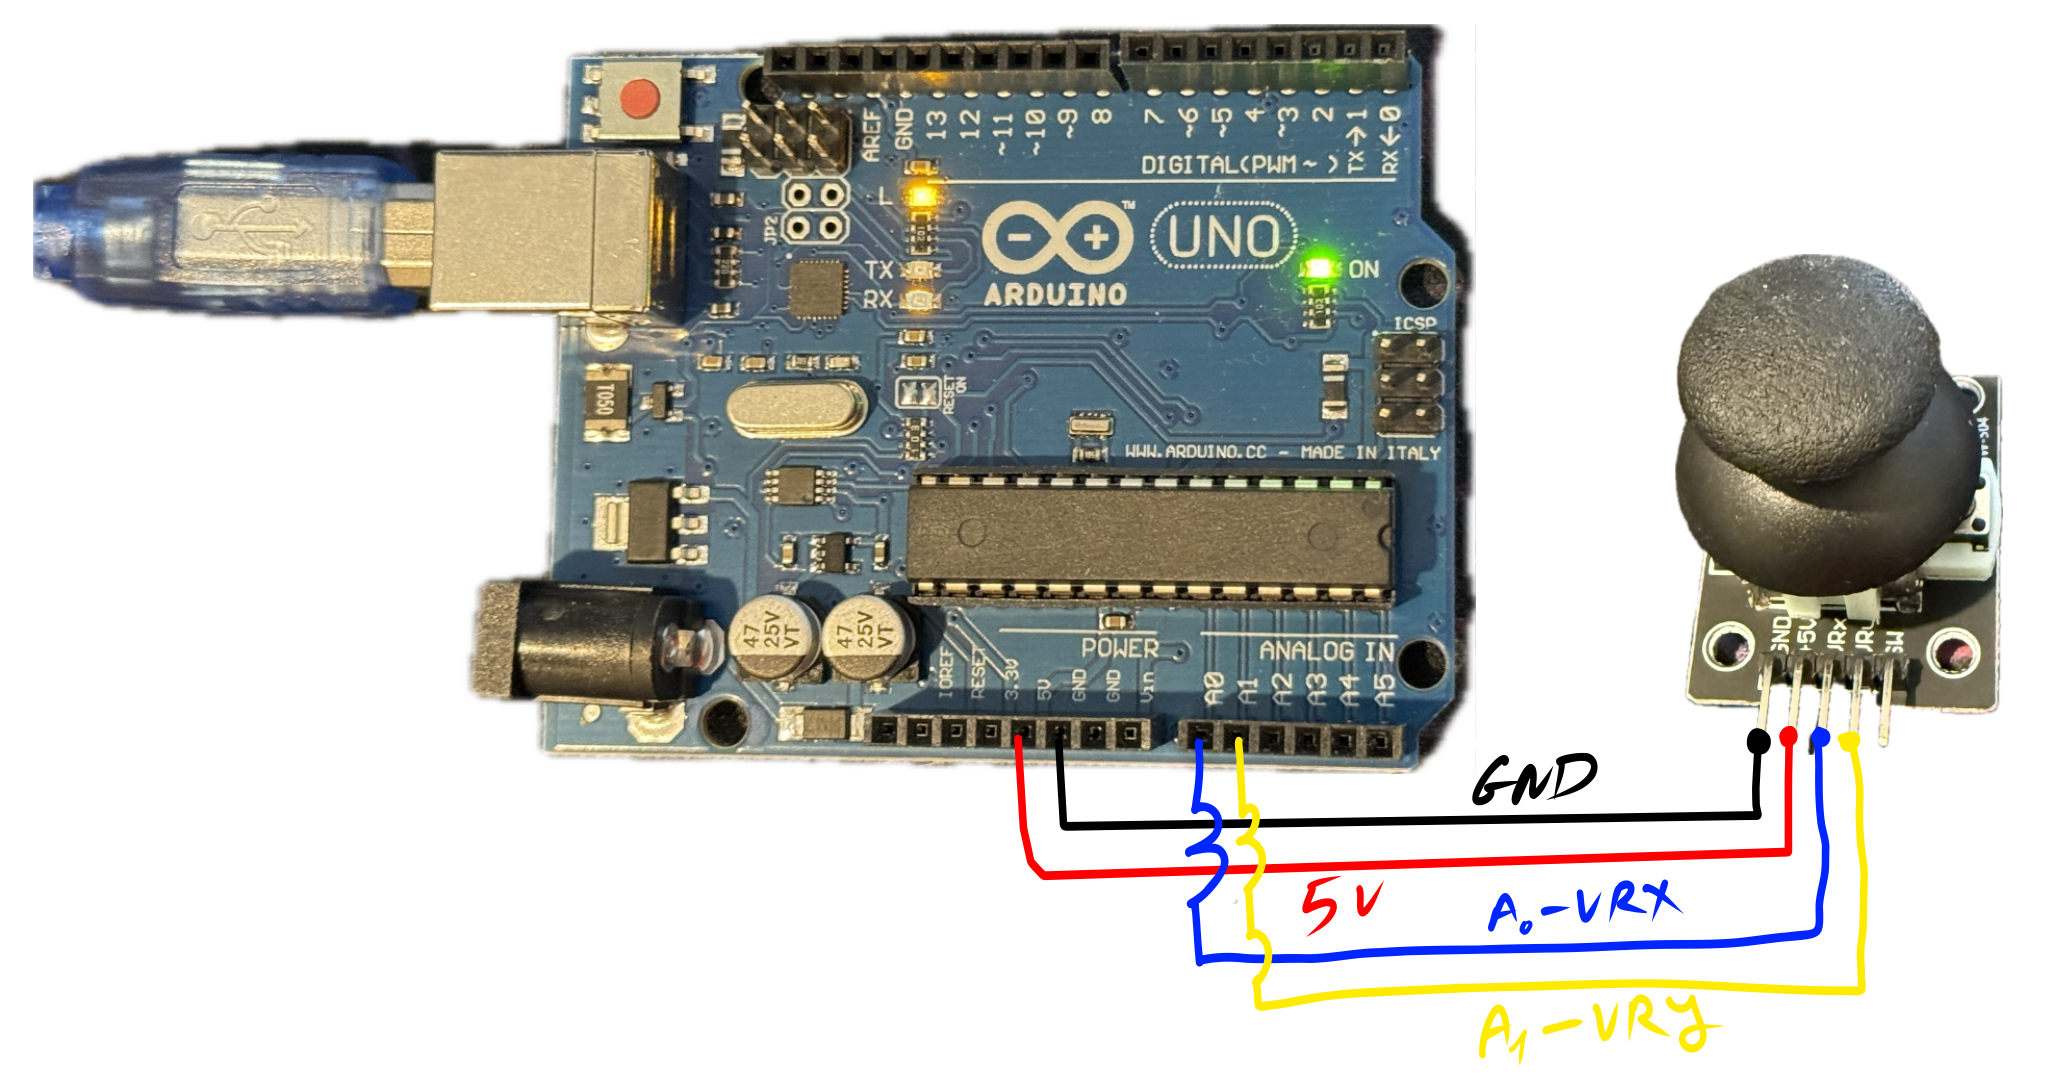
Joystick Circuit Diagram
Most joystick modules have 5 pins:
- GND: Connect to Arduino GND.
- +5V: Connect to Arduino 5V.
- VRx: X-axis output. Connect to an analog pin (e.g., A0).
- VRy: Y-axis output. Connect to another analog pin (e.g., A1).
- SW: Switch/button output (we will ignore this for now).